Architecture #
Overview #
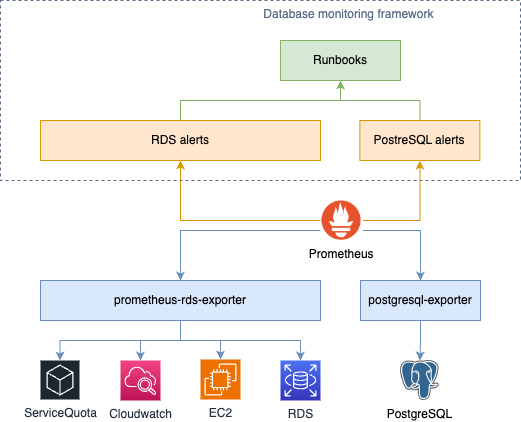
Components #
Prometheus RDS exporter #
The Prometheus RDS exporter collects key metrics from the different AWS APIs (RDS, Cloudwatch, EC2, and ServiceQuota) to have the full picture of servers’s hardware capacity and utilization.
This component is optional but highly recommended for AWS customers.
Prometheus PostgreSQL exporter #
Tips
This section is outdated for DMF version >beta.10 because of ongoing migration toward burningalchemist/sql_exporter. Stay tuned!
The Prometheus Postgres exporter collects PostgreSQL internal metrics using system tables.
We override its default configuration to collect additional metrics to trigger advanced alerts and analyze trends over time.
This component is optional but highly recommended to analyze PostgreSQL metrics over time.
Prometheus alerts #
Monitoring alerts are defined in Prometheus rule format and work out of the box with the RDS and PostgreSQL exporters in Kubernetes environment with Prometheus operator.
They are distributed via Helm chart for convenient deployment:
| Helm chart | Description |
|---|---|
| prometheus-rds-alerts-chart | Alerts for AWS RDS |
| prometheus-postgresql-alerts-chart | Alerts for PostgreSQL |
The charts deploy Prometheus PrometheusRule Kubernetes resources. So Prometheus automatically discover the alerts.
Runbooks #
Runbooks are hosted on https://qonto.github.io/database-monitoring-framework for convenience.
It’s a static website generated using Hugo with book template.
Deployment #
While it’s initially designed to be deployed in AWS + Kubernetes environment, Helm charts could be deployed in any Kubernetes cluster.